
Social Media Checkup 2021
At The Parish Group, we’re always keeping our finger on the pulse of the social media giants.
For the better part of a decade, we’ve been empathizing with clients who grow increasingly frustrated at restrictive algorithms and feel too strained to give social media management its due.
Industry wide, social media hasn’t become a mastered habit for colleges and universities and their enrollment offices.
While some schools have found their stride with posting engaging content at the right intervals, most don’t have a sustainable process for developing new content and feel overwhelmed by the prospect of social listening.
On paper, something schools are so ready to avoid would slide even further on the back burner during the 2020-2021 cycle. But that has not been the case.
Each of our client-partners and prospects have mentioned renewed attention in the social media landscape. And when every enrollment manager we know is wearing about 73 hats, we see this isn’t a ploy to get to 74.
Social media matters more this year.
For many students and much of the year, they couldn’t come to you and you couldn’t go to them.
With campus visits down, ill-attended virtual college fairs, and a lack of relationship building with school counselors, it’s no wonder we’re looking to find students where they are; now more than ever.
And we all know where they are.
Or do we?
Over the years, we’ve developed a narrative that certain social media platforms are for certain demographics.
Snapchat and TikTok are for the teenagers (and wildly uncomfortable territory for enrollment managers).
Instagram and Twitter are for teens and 20-year-olds and those of us who want to be. Facebook is ads, baby pictures, cat pictures, and unsolicited political advice for those in their 30s-40s.
LinkedIn is for an older, more professional audience.
Twitter is for famous people or teens who want to be.
YouTube is somehow for everyone and no one. That’s what we’ve heard at least, but it’s time for a social media checkup!
We’ve done our homework and have created cheat sheets for you!
Here’s a look at the social media platforms we recommend most for colleges and universities in 2021.
Obviously having a presence isn’t enough and while we’ll get into best practices of posting in a future article, you can always contact us directly to continue this conversation!
Facebook
- Facebook has 7 billion monthly active users and represents 42% of the world’s population.
- Contrary to popular opinion, its largest user base is quite young, with 86% of those 18-29 using Facebook actively.
- Household income doesn’t have a great effect on likely use of Facebook; 85% of households with annual income under $30k are present and 86% of households with over $100 per year are as well.
- Gender is trending 54% female.
- The average user spends 35 minutes per day on the platform.
- 96% of users access Facebook via mobile and only 35% via laptop or desktop.
YouTube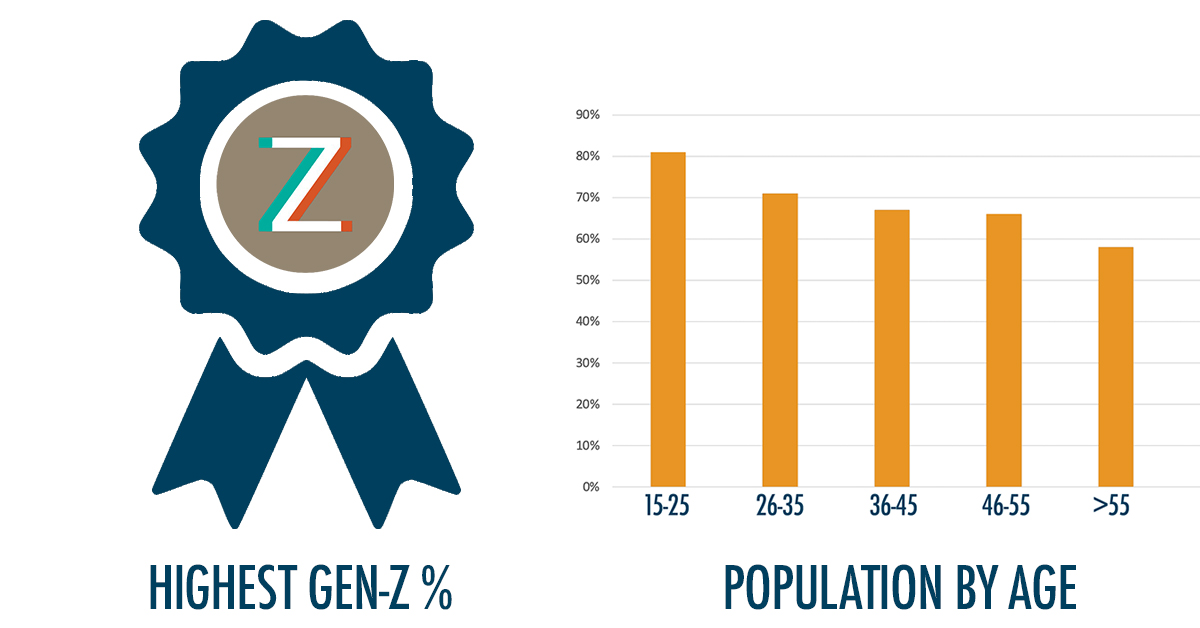
![]()
- YouTube has 2 billion monthly active users.
- Over 80% of those 15-25 are active on YouTube.
- Regardless of income level, over 80% of homes are regularly present. For households with annual incomes over $100k, 89% use YouTube.
- The gender ratio is almost even with females making up slightly more than 50%.
- The average session is under 12 minutes per day.
- Over 70% of views are through mobile
- Instagram has 1 billion monthly active users, half of whom logon daily.
- The audience skews young with 67% of 18–29-year-olds using Instagram.
- The user income rates for Instagram are unusual. About 45% of those with annual household incomes of $60k or $80-100k use Instagram. The in-between bracket of users with $60-70k/year incomes are least likely to be on Instagram (36%) but their slightly wealthier neighbors are disproportionately more likely to be members with 55% of those earning $70-80k/year on the platform. The user base tops out with 60% representation of households earning more than $100k per year.
- Instagram holds a more even gender representation than Facebook with 51% female and 49% male.
- The average user spends 53 minutes per day on the platform.
- 83% of users claim to discover new products and services through Instagram. Though owned by Facebook, businesses haven’t experienced the same algorithmic hit to their posts within this platform, which has shifted many companies to Instagram. In fact, 71% of US businesses have an Instagram account.
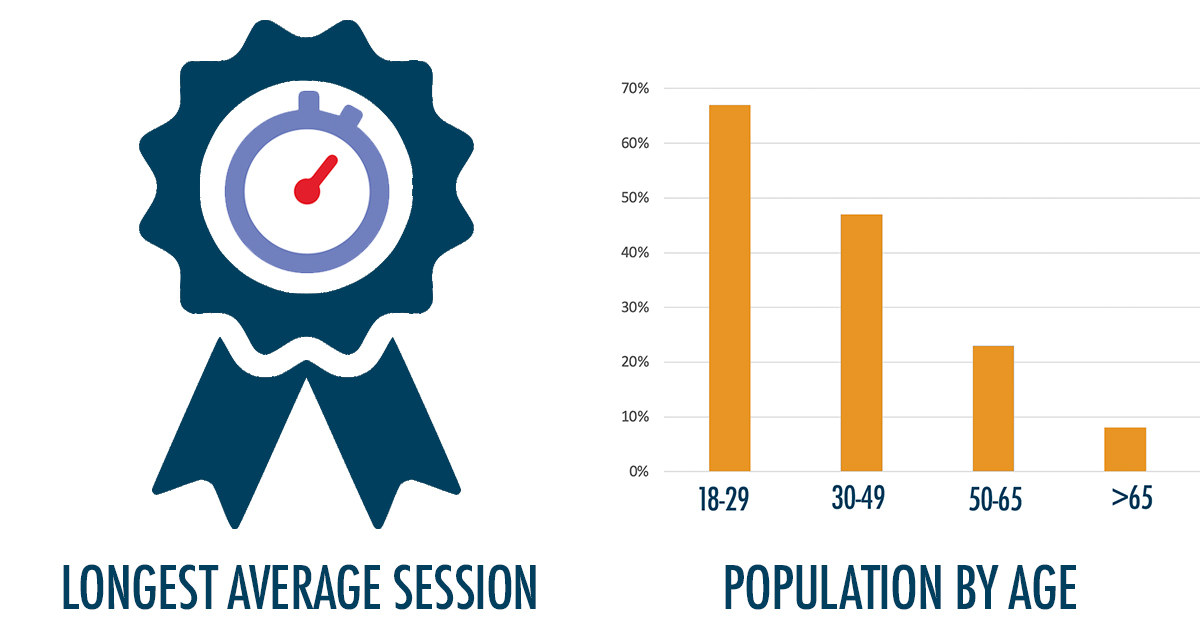
TikTok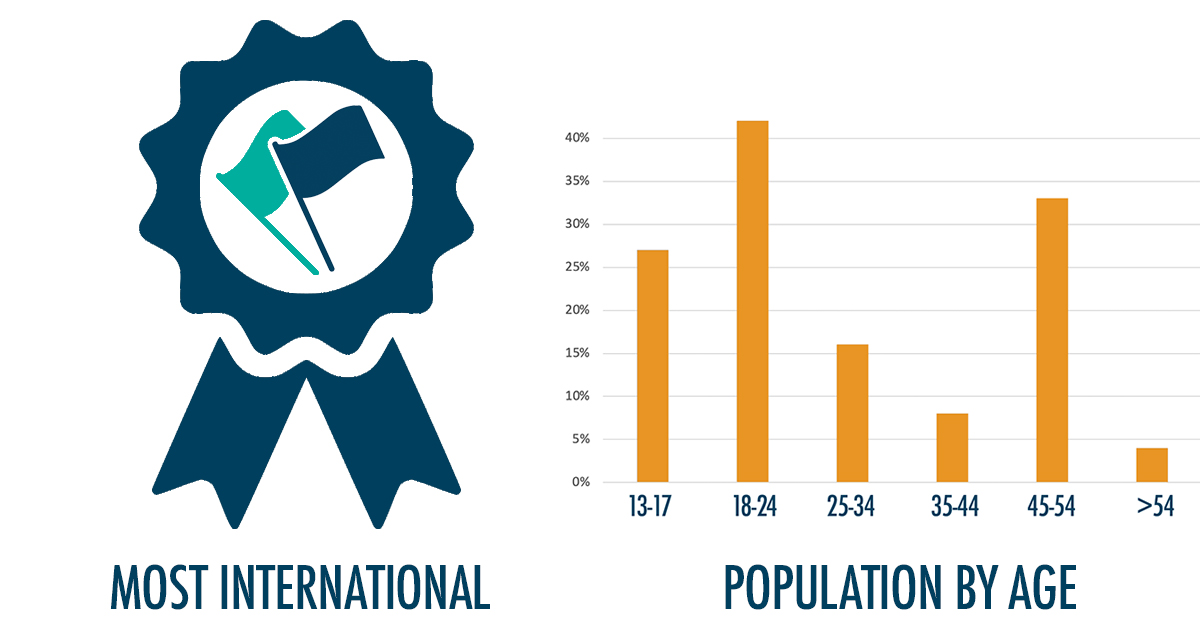
- TikTok has 800 million monthly active users, 30 million of whom are in the US.
- Nearly half of users are between 18-24-years-old.
- TikTok has a 60% female audience.
- The average session is 46 minutes per day.
- Educational content has been among TikTok’s largest trends, especially in India and China. @TikTokEduTok
- TikTok is the most internationally friendly social media platform, available in over 150 countries.
- TikTok was the most downloaded app in 2020.
SnapChat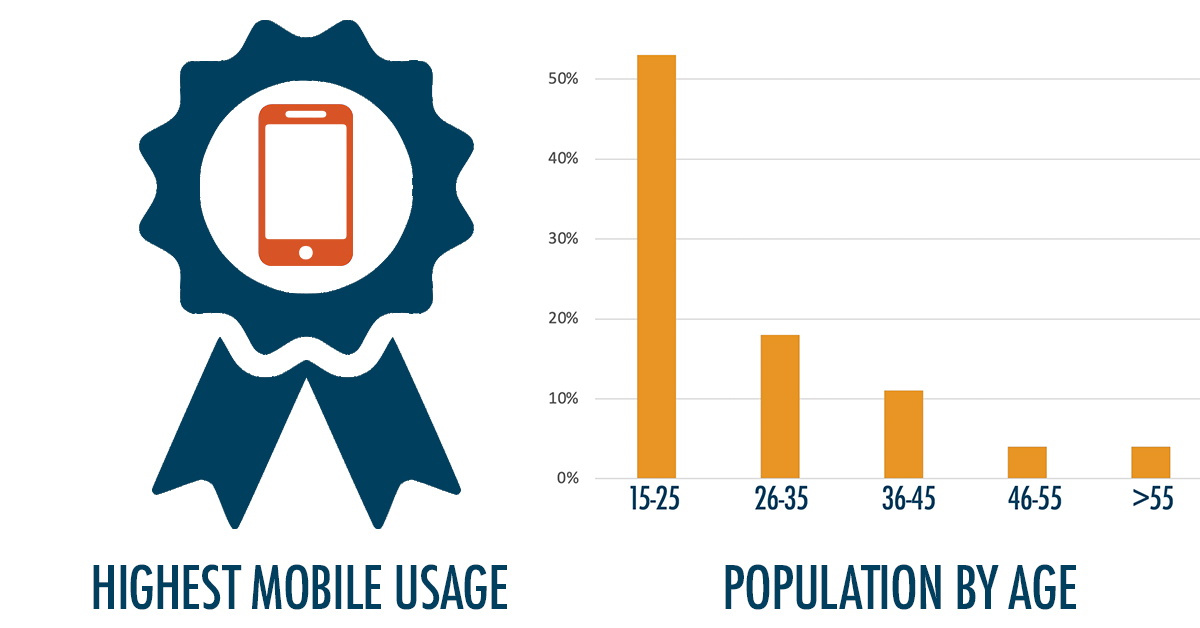
- SnapChat has 381 million monthly active users.
- 53% of 15-25-year-olds use Snapchat. Parenthetically, 4% of those over 55 use SnapChat. WHO EVEN ARE THEY?
- SnapChat represents about 30-40% of homes regardless of income level and peaks at 42% of those earning $70-80k annually.
- The gender breakdown is 61% female and 38% male.
- The average session is 30 minutes per day.
- SnapChat is only available on mobile devices.
- The Snapchat app is currently second place for overall mobile usage.
Twitter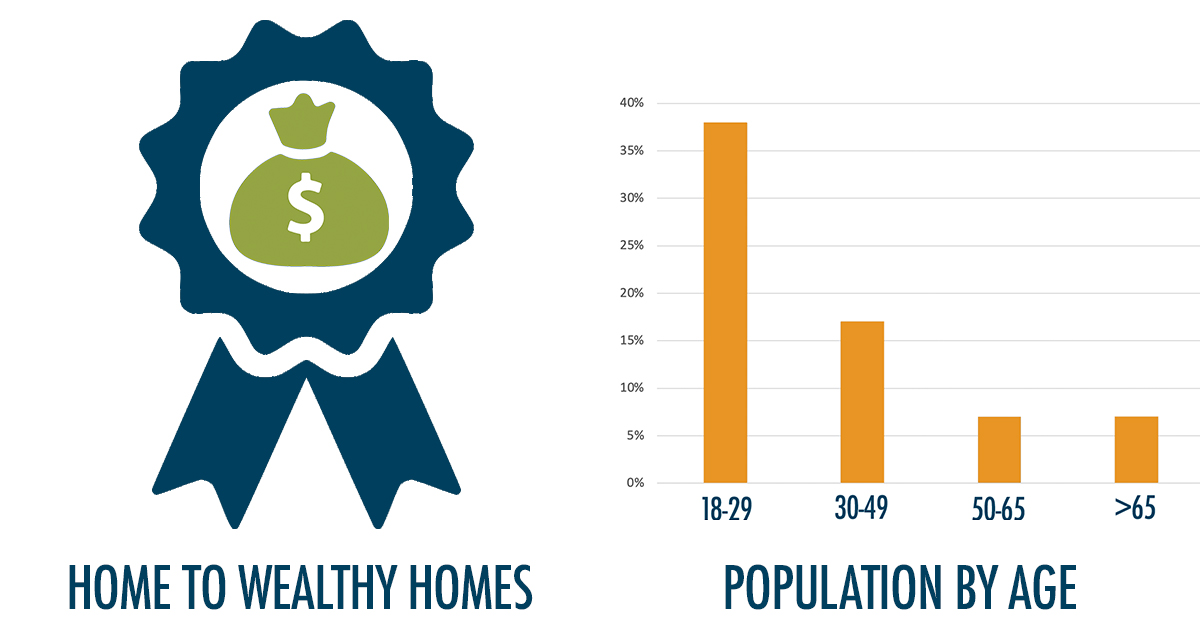
- Twitter has 330 million monthly active users.
- This platform trends young and represents 38% of those 18-29.
- Those with incomes above $75k annually are nearly twice as likely to use Twitter as those making $30k per year or less.
- Twitter’s gender breakdown is an exact 50/50 split.
- Twitter sessions are short, with average users spending under 4 minutes each.
- 77% of users report a better impression of a brand when they respond to a tweet.
LinkedIn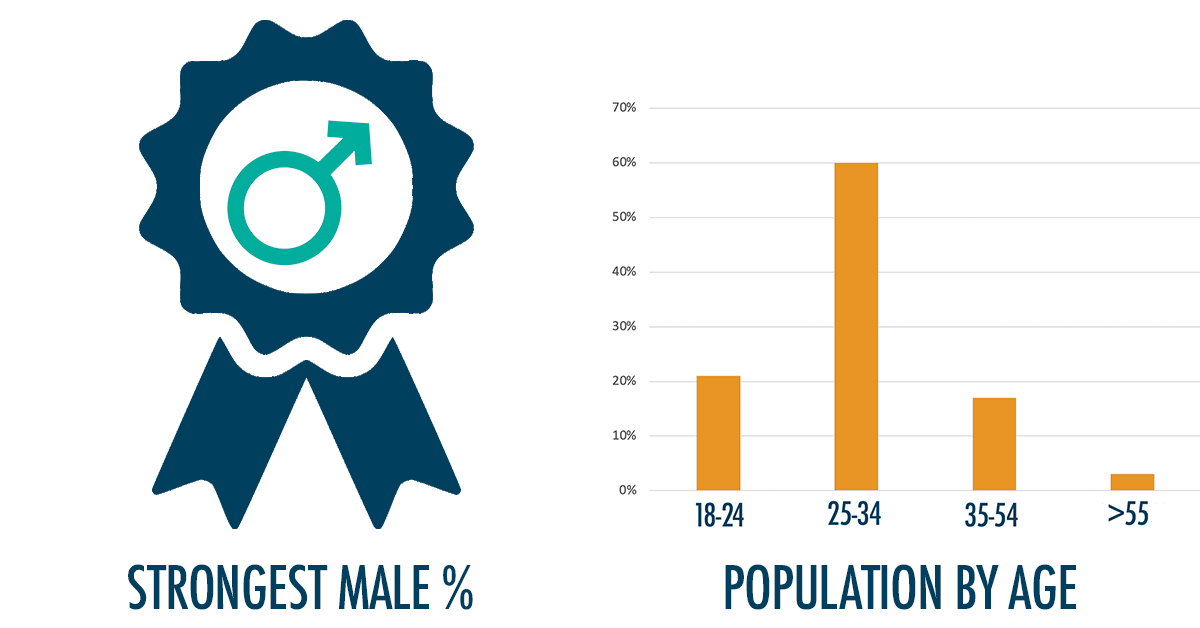
- LinkedIn has 260 million monthly active users.
- Though it has a reputation of serving older populations, this platform represents 60% of those 25-34.
- Under of half of homes generating less than $80k per year are on LinkedIn. Half of those with incomes between $80-100k annually are on LinkedIn, as well as 60% those earning over $100k per year.
- LinkedIn is one of only male dominate social media platforms with a 57% masculine audience.
- Users spend just over 6 minutes per session.
- 57% of LinkedIn traffic is through mobile use.
There you have it: a reset view of who’s where.
So where will you go?
We’re eager to hear of your social media plans! Feel free to contact us to collaborate on further strategies.
There’s never been a better time to meaningfully, effectively use social media for your enrollment management efforts.